Matthew's Correlation Coefficient
This is a metric that fixes some of the issues with the F1 score what we shall explore. It is highly recommended that you check out the F1 score metric before moving over to this one.
Let's understand how it works with this example.
Example#
We have a binary classification model that detects whether a given image contains a person or a horse. We have 4 images of horses and 20 of humans.
Here's what the confusion matrix for the predictions from a model looks like:
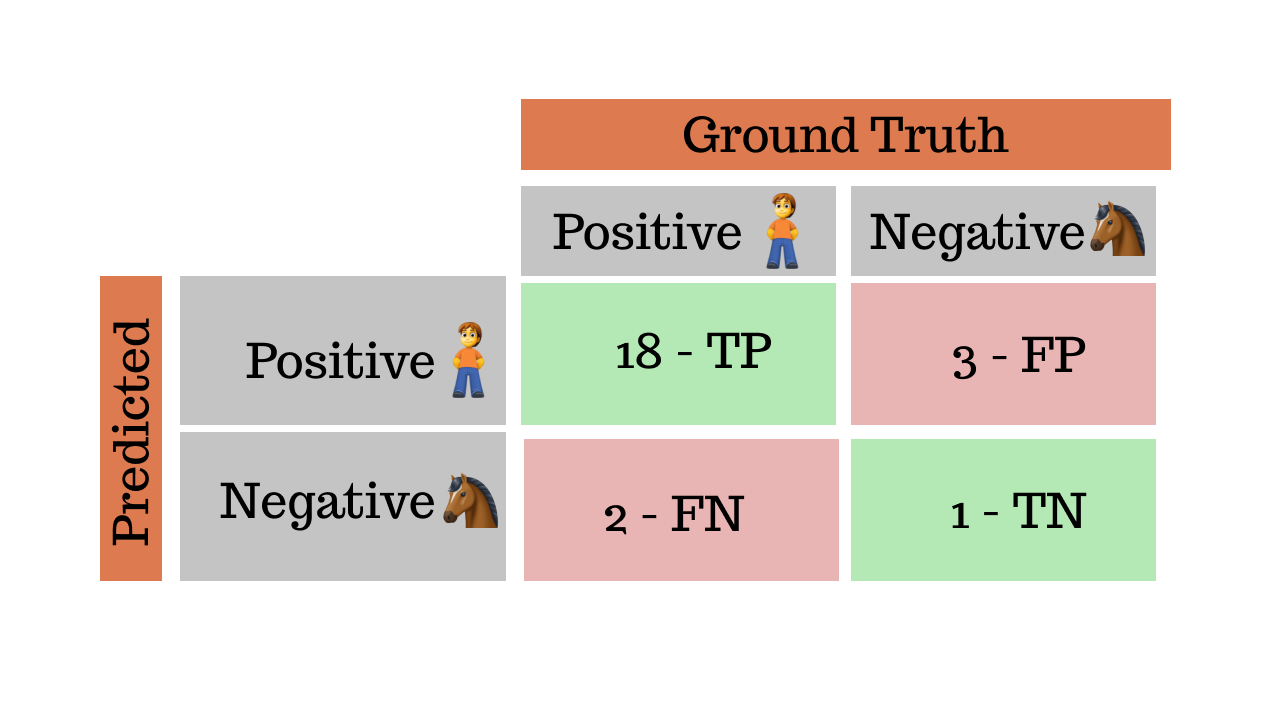
If you go ahead and do the math, this matrix gives us a precision of 86%, recall of 90% and F1 score of 88%. Which basically means our model is doing a pretty good job at classifying people in the images. But what about the horses?
The problem#
This is where the problem starts, we have 4 images of horses and 1 of them was classified correctly, the F1 score ignores True Negatives so this does not get reflected.
To illustrate the point, let's use this exact model except the horses are the positive class and the humans are the negative class.
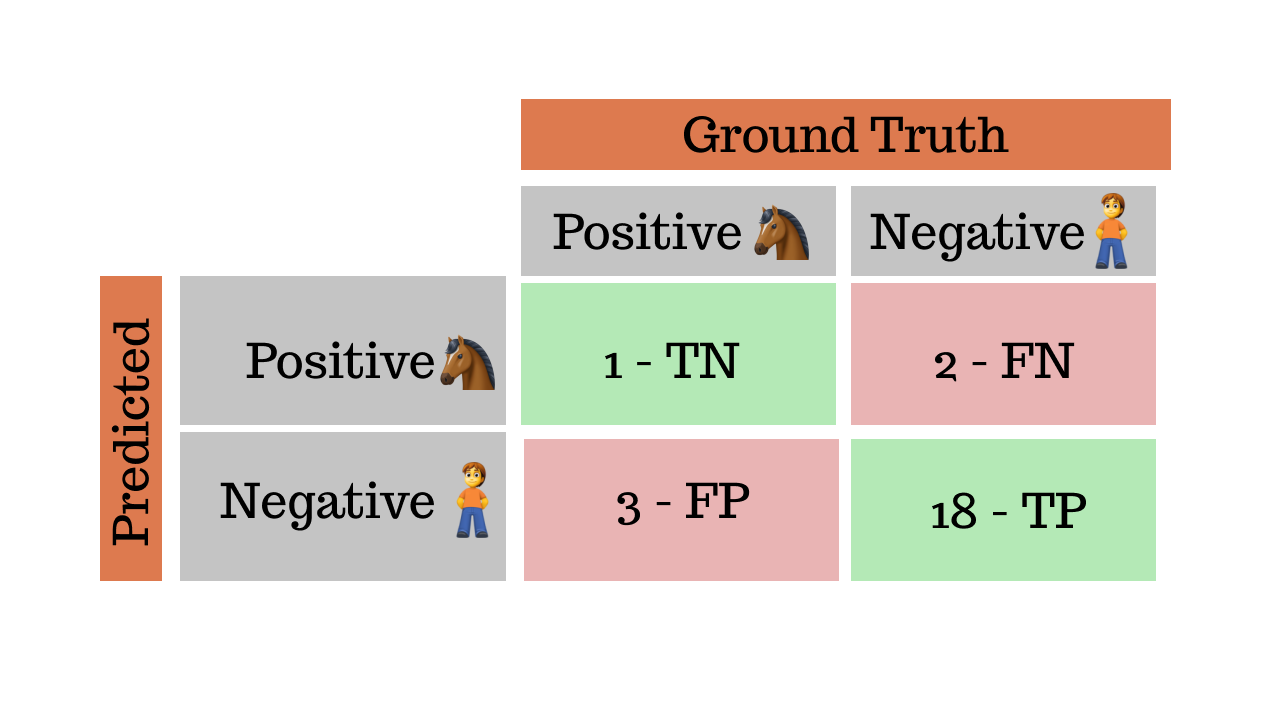
The precision is now 33%, recall at 25% and finally the F1 score is at 29%. Basically the model is not great at classifying the images of horses.
This again comes back to the fact that the F1 score is a metric that is highly dependent on the number of true positives, false positives and false negatives but not true negatives.
Accuracy will not be a good metric to use in this case, due to the imbalance of the classes.
The solution#
The Matthew's Correlation Coefficient is a metric that is more robust to the imbalance in such cases, it takes into account all four scenarios of the confusion matrix: TP, FP, FN and TN.
Formally, it is defined as:
Interpretation#
It ranges from -1,the exact opposite of an ideal classifier to 0, a random classifier and then 1, an ideal classifier. Unlike the F1 score, the MCC is asymmmetric, meaning no class has greater influence than the other.
Finally if we calculate the Matthew's Correlation Coefficient for the same example as above, we get a value of 0.17 which is fairly low.
This explains why our model is doing a pretty good job at classifying the images of humans but not for horses.